Forex indicators help traders understand what is happening on a currency price chart. They show useful information about trends, price strength, and market activity.
For example, EUR/USD may rise throughout the morning and then suddenly start falling. Is the market changing direction, or is this just a small price drop?
Trading indicators can help you study these movements. However, they cannot tell you exactly what will happen next.
If you are starting with the basics of forex trading, learning how these tools work can make charts easier to understand.
What Do Forex Indicators Actually Tell You?
Think about driving a car. You check the speedometer to see how fast you are going, but it does not tell you what is around the next corner.
Trading indicators work in a similar way.
They use market data to show useful details about recent price activity. They cannot tell you exactly what will happen next.
Before choosing an indicator, ask yourself what you want to know.
Are prices generally rising? Is the current movement strong? Has the market become more active?
Different indicators help answer different questions.
What Are Forex Indicators and How Do They Work?
Forex indicators use past market prices to help traders study currency movements.
Some appear directly on the chart, while others appear below it.
For example, a Moving Average helps you understand price direction. RSI shows the strength of recent price movements.
The best approach is to understand what each indicator measures before using it in a trade
6 Forex Indicators Worth Understanding
You will find many trading tools online. Some are free, while others are sold as advanced trading systems.
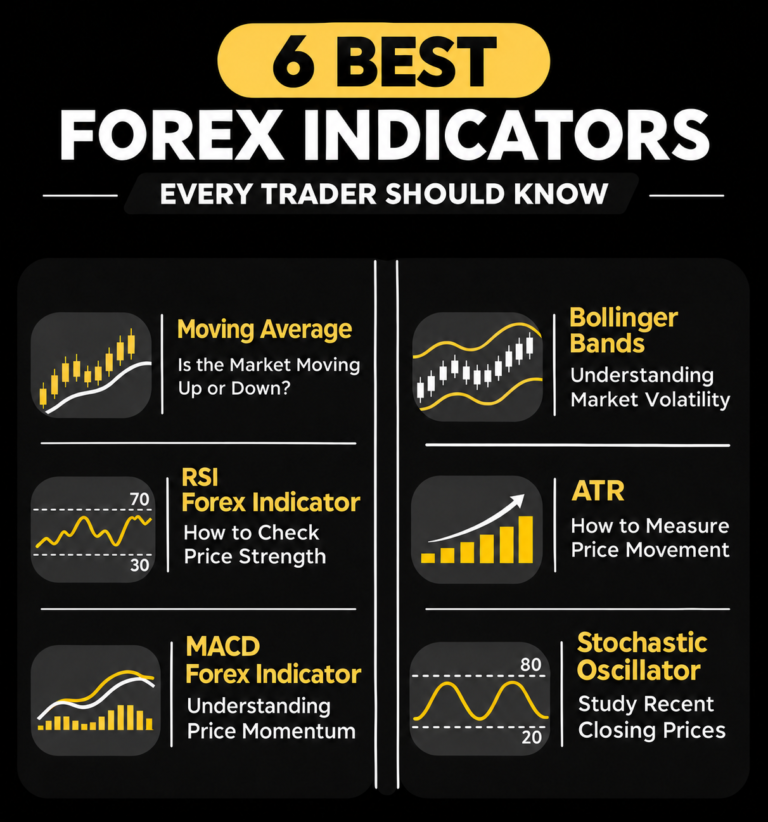
You do not need all of them. These six indicators are a useful starting point.
1. Moving Average: Is the Market Moving Up or Down?
Imagine EUR/USD has been rising for several days, but the chart contains many small ups and downs.
A Moving Average helps you see the bigger picture.
It takes prices from a chosen number of candles and calculates their average.
For instance, a 20-period Moving Average uses information from the latest 20 candles.
If the line is gradually moving upward, it tells you that average prices have been increasing.
A downward-sloping line shows the opposite.
Traders can choose different periods depending on how much price history they want to study.
Keep in mind: A Moving Average follows price changes. It cannot warn you about every sudden market reversal.
2. RSI Forex Indicator: How to Check Price Strength
Suppose GBP/USD has climbed quickly over several candles.
You may wonder whether the buying pressure is unusually strong.
The Relative Strength Index (RSI) helps you examine this.
Its readings range from 0 to 100.
A number above 70 is commonly called overbought. A number below 30 is commonly called oversold.
However, these words can be confusing.
Overbought does not mean you must sell. It simply shows that recent gains have been strong compared with recent losses.
A market can continue rising even after RSI moves above 70.
RSI is helpful when you want to understand momentum, but it should not make the entire trading decision.
3. MACD Forex Indicator: Understanding Price Momentum
Sometimes a currency pair continues rising, but its upward movement starts slowing down.
MACD can help traders notice changes like this.
The indicator uses two calculated lines and a histogram.
Traders often watch how the MACD line moves compared with its signal line.
For example, imagine EUR/USD has been climbing steadily. Later, MACD begins showing weaker upward momentum.
This may encourage a trader to look more closely at the chart.
It does not prove that the price will reverse.
MACD can also produce confusing signals when prices move back and forth without a strong trend.
4. Bollinger Bands: Understanding Market Volatility
Not every trading day looks the same.
Sometimes prices move very little. On other days, one news report can cause a large movement.
Bollinger Bands help you see changes in how widely prices move.
The indicator places two bands around a central average.
Imagine watching GBP/USD during a quiet morning. The bands may move closer together because recent price changes have been small.
Later, prices begin moving sharply. The bands may spread further apart.
This shows that the market has become more volatile.
A narrow band does not promise that a breakout is coming, and a wide band does not tell you when the market will calm down.
5. ATR: How to Measure Price Movement
Let’s say you are studying EUR/USD and want to know whether recent daily movements have been large or small.
Average True Range (ATR) can help answer that question.
ATR looks at recent price ranges and calculates an average.
Suppose the daily ATR is 0.0070.
For EUR/USD, that equals around 70 pips.
This tells you about the size of recent daily movements. It does not mean tomorrow’s price must move exactly 70 pips.
Some traders consider ATR when deciding how much space to leave between an entry and a stop-loss.
But the stop-loss must also fit the trading plan and the amount of money at risk.
6. Stochastic Oscillator: Study Recent Closing Prices
Imagine EUR/AUD has spent most of the day moving between two price levels.
You want to know whether its latest closing price is near the top or bottom of that recent range.
The Stochastic Oscillator is designed to show this relationship.
Its readings run from 0 to 100.
A reading near 90 tells you that the recent closing price is near the upper part of the selected range.
A reading near 10 suggests that the closing price is near the lower part.
Traders often watch the 80 and 20 levels.
However, a high reading does not mean a fall is certain. During a strong trend, the price can remain near one end of its range for a long time.
How Do You Choose the Best Forex Indicator?
Choosing the best forex indicator becomes easier when you know what you want to study.
For example, if you want to understand direction, start with a Moving Average.
If you want to check whether recent price moves are gaining or losing strength, RSI or MACD may help.
If large price swings are your concern, ATR or Bollinger Bands may be more useful.
There is little value in adding several tools that provide almost the same information.
The IG explanation of forex indicators also covers how technical tools are used to study market behaviour.
Are Free Forex Indicators Good Enough?
Yes. Many free forex indicators provide useful information for beginners.
MetaTrader 4 and MetaTrader 5 include commonly used trading tools such as Moving Average, RSI, MACD, and Bollinger Bands.
Paid indicators may provide additional alerts or settings, but they do not guarantee better trading results.
The same applies to automated forex trading robots. These systems can follow trading rules automatically, but they can still make losing trades.
A Simple Way to Use Indicators on EUR/AUD
Let’s take a basic example.
You are watching EUR/AUD on a four-hour chart.
First, you add a Moving Average to see the overall direction.
Next, you check RSI to understand recent momentum.
Finally, you look at ATR to see how widely prices have been moving.
Suppose the Moving Average is rising, RSI reads 57, and ATR shows larger movements than usual.
You now have a clearer picture of recent market activity.
However, this is not enough to say you should buy.
You still need to consider news from Europe and Australia, trading costs, and the risk of losing money.
This is how EUR/AUD forex technical analysis indicators can support a trading plan without replacing your own judgment.
Do You Need Paid Indicators to Start Trading?
No. Many free forex indicators already provide the information beginners need.
MetaTrader platforms include tools for studying trends, momentum, and volatility.
Some paid indicators offer additional alerts, settings, or visual features.
These may be convenient, but they do not guarantee better decisions.
The same applies to automated forex trading robots. A program can follow instructions consistently, but it can still produce losing trades.
For beginners, practising with simple tools on a demo account is a sensible place to start.
What Should Beginners Avoid?
A new trader may see an indicator turn green and assume it is time to buy.
That is a common mistake.
A colour change or a line crossing another line is not enough to understand the full market.
It is also easy to keep changing indicator settings after a losing trade. Doing this makes it harder to judge whether a method works over time.
Instead, choose a small number of tools, understand their purpose, and record what happens when you use them.
Be careful during important economic announcements, when prices and trading costs can change quickly.
Conclusion
You do not need a complicated chart to understand currency movements.
Forex indicators can help you study price direction, momentum, and volatility. Each tool gives you a different view of the market.
Start with the information you need rather than trying every indicator available.
Your trading results also depend on costs, order execution, and risk. Understanding forex broker trading conditions is part of making informed decisions.
Give yourself time to practise. A useful indicator is one you understand well enough to recognise both its strengths and its limits.
Disclaimer: This article is for education only and is not financial advice. Forex trading carries risk, and leveraged trades can lead to significant losses.
Frequently Asked Questions...
A Moving Average is a simple starting point because it helps show the general direction of recent prices.
You can study RSI on its own, but relying on one reading may lead to poor decisions. Price trends and risk also matter.
Yes. Many free tools provide enough information for beginners to practise chart analysis. Paid tools do not guarantee better results.
Yes. Indicators are based mainly on historical prices, so their signals may be delayed or misleading.
Starting with one or two indicators is reasonable. You can add another tool later if it provides useful information that is missing.
References
IG – Technical Analysis Guide
https://www.ig.com/uk/forex/fx-need-to-knows/forex-indicators
MetaTrader 4 – Official Platform Documentation
https://www.metatrader4.com/en/trading-platform/help/analytics/tech_indicators